Firefox-CI 502 errors post mortem
Below is a multi-month investigation of 502 GLB errors. Scroll down to summary for the tl;dr
Firefox-CI 502s post mortem
Firefox-CI (a Taskcluster deployment) is a distributed system that orchestrates millions of tasks daily, making sure they are being scheduled, executed and resolved. It was built in such a way that any operation could be retried in case of a server failure.
However, if you have large amounts of errors, it might make the system much slower, increase execution time of tasks and introduce unnecessary delays and disruptions.
Firefox-CI runs on Google Cloud Platform in Kubernetes and uses Google Load Balancer.
Timeline

After noticing a big amount of 5xx daily errors and were able to find the root causes and reduce those from 40k-50k/day to zero.
Almost all of those 502 errors were sent with a timeout (30s - 120s), which means that clients had to wait around 75s on average before retrying failed calls.
That means that we could save daily on average 45.000 * 75s = 3.375.000s (~930 hours).
Investigation
While identifying an issue with workers, which would shut themselves down while running a task, I noticed that a few API calls returned 502 errors around the same time.
One particular issue with 502 is that it was happening on the Load Balancer and client side. But on the services side, logs suggested that the call executed successfully and returned some payload.
Flow is:
- Worker calling
queue.claimWork() - Queue service handles the request and sends back response with the payload
- Response is lost at transmission somewhere between the service and Load Balancer
- Worker gets a
502error and keeps retrying the call.
Note: That means that the system thinks that worker received a response, but in reality, it was lost somewhere in the network stack.
Client libraries can handle server-side errors, but the problem with those is that it can take a random amount of time to see that error, usually between 30s-120s.
Schematically, network stack in cloud infrastructure consists of:
- API server (node.js application) running on a kubernetes POD
- Kubernetes service that exposes this particular pod
- Ingress service that proxies all incoming calls to the underlying services
- Load Balancer’s backend that is running on instance groups (k8s nodes)
- Google Load Balancer that accepts HTTP requests from the world and passes down to services
This leads to an assumption that calls are “getting lost” somewhere between 1-5 elements of this chain.
Question: where exactly? (Spoiler: everywhere)
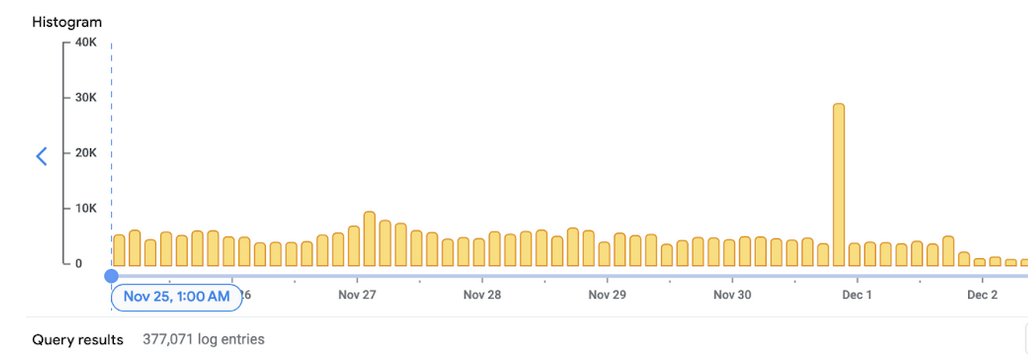
Checking logs showed that those 502 errors happen frequently and in extremely large quantities!
Somewhere around 40.000 - 50.000 errors a day!
Analysis of existing errors revealed some patterns:
- Most of the 5xx errors are 502s (>95%)
- 502 errors have different types of errors:
response_sent_by_backendbackend_timeoutfailed_to_connect_to_backendbackend_connection_closed_before_data_sent_to_client
- Errors were usually seen in spikes, some of them happened daily around the same time
Suspect #1 - keepalive timeouts
Based on types of errors, one in particular stood out - backend_connection_closed_before_data_sent_to_client which contributed to more than 85% of failures.
GCP’s troubleshooting guide hinted that keepalive timeout might be out of sync between GLB, ingress and services.
GLB has fixed keepalive timeout of 600s.
Nginx’s (ingress) keepalive timeout was not set, as well as service’s.
That means that GLB can keep connections open and send requests after a connection was being closed by ingress or service.
Patch was applied to set bigger keepalive timeouts for the nginx ingress service.
Similar change was applied on the services side: #6692 to make server keep connection to ingress open longer. #5267 was added to set some numbers for the deployment.
Keepalive timeout tweaks were helping - number of errors dropped from 40-50k a day to 4-5k a day

Backend_connection_closed_before_data_sent_to_client errors were mostly gone, and new target was to find out what causes remaining timeouts.
Suspect #2 - pod autoscaling
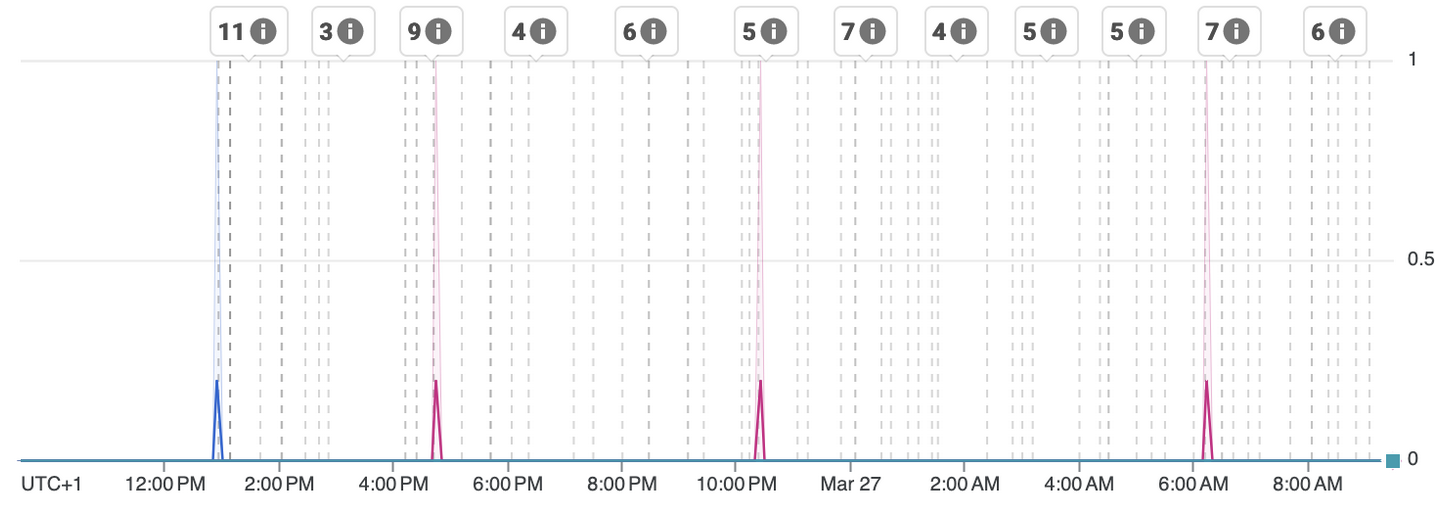
Once the majority of errors disappeared, it became easier to spot a few irregularities in those errors - there were spikes.
And those spikes were happening during pod autoscaling:


FirefoxCI cluster runs few HPA (Horizontal Pod Autoscalers) for ingress and queue, auth services to scale pods up and down based on demand (CPU utilization).
Those events happened frequently, which led to the termination of a big number of pods.
Also it was quite easy to verify - disabling HPA showed that the number of errors was much lower.
Suspect #3 - graceful termination
Pods being terminated is a usual thing, and they must be ready, at least in theory, to handle terminations gracefully.
When kubernetes tells pod that it needs to be terminated (pod autoscaler requests this), it would send a SIGTERM signal to the container and would wait at most terminationGracePeriodSeconds, before it would be forced killed.
Kubernetes also allows running custom handlers when POD is about to be terminated. lifecycle.preStop hook is being invoked before SIGTERM is sent.
Flow here is:
- HPA requests deployment to be scale down (i.e. we don’t need 20 pods of this service, only 15)
- Kubernetes decides which pods to terminate
lifecycle.preStophook is calledSIGTERMsignal is sent to container- Kubernetes waits for pod to finish up to
terminationGracePeriodSeconds - Pod is being terminated
Taskcluster up until this point didn’t define any custom preStop hook, or didn’t handle SIGTERM gracefully, but rather just stopped the process, dropping all open connections.
Nginx ingress handled it in some way, but that was not good enough, so few fixes were made:
- #6717 added
SIGTERMlistener in services in attempt to let existing connections finish before process is being killed - #6718 added
lifecycle.preStoproutine which is simply asleep 30sat that point. - ingress preStop hook improved to wait for all processes to finish serving requests:
Sleep XXs importance is as follows: Kubernetes controls the flow of incoming requests by using network endpoints. During lifecycle events (creation, termination), it would create or remove network endpoints for those pods. Due to the async nature of kubernetes events, during pod termination, it is not guaranteed that new requests will not be sent to a stopping pod right away. When we add sleep xx to the preStop hook, we make sure that no requests are lost before the network endpoint finally disconnects that pod from new traffic. Existing connections would not be affected, and server would finish serving them after receiving the SIGTERM signal.
Nginx’s stopping procedure became:
sleep 5; nginx -s quit; while pgrep -x nginx; do sleep 1; done
This was necessary because nginx spawns worker processes, and when main processes receive SIGTERM, it would not stop immediately, it would only notify workers. Checking if nginx processes are still running is a way to know that open connections are still being served
Things start to look better after those fixes, total number of daily errors dropped even more:

Further steps
At this point it became really hard to figure out the root cause of the remaining errors. There were few assumptions:
- Keepalive timeouts were too big or to small
preStopsleep time was too high or too low- GLB or backends configuration is not optimal
- HorizontalPodAutscaler might be killing too many pods at once
More observations
- HPA would scale down very fast and kill too many pods at once.
- Containers (pods) are being restarted
Suspect #4 - container restarts
Noticing that some spikes occur at a given time of the day and seeing the number of container restarts it became clear that this is an important factor, too.
Turned out, that it was “by design” - #1727
Assumption in the past was that containers should not be running for too long, and were forced to be restarted daily.
#6759 fixes were made to address that.
Side quest achievement - websocktunnel and livelog
Looking at container restarts and lost connections, we were able to make a conclusion that websocktunnel might be suffering from similar issues. #6563
Websocktunnel is being used to stream live logs from running tasks to the browser. Due to some memory leaks, that container would be restarted, and due to some other bugs in worker implementation, it would not properly connect back to the tunnel. Which means long-running tasks (like machine learning for translations that run for days) would be running without logs being visible.
Increasing memory limits helped to avoid restarting containers too often, and made livelogs more stable. Restarts went down from multiple a day to once in 10-15 days.
More tweaks
More kubernetes configuration and application fixes were added in #6760
Suspect #5 - node autoscaling
It became apparent that the majority of remaining 502s are happening during cluster scaling events.
GCP allows us to configure the cluster to have a variable number of nodes in the cluster, based on the current load.
Observing logs revealed that this is happening quite frequently. Nodes are being added and then removed. During node draining and removal, more connections were still being lost.
Few weeks of experimenting with timeouts, keepalives, grace termination periods and sleep delays couldn’t help reduce the number of errors.
At this point I decided to disable this feature, and keep cluster running a fixed number of nodes. Cost savings from autoscaling were not substantial for FxCI, as it was mostly single node being added and removed during the day.
Even GCP documentation suggests disabling this feature where dropped connections should be an issue.
By disabling node autoscaling we were able to get rid of most of the 502s which means that clients would not be affected by random 30s-120s delays, and be forced to retry api calls. Which makes the whole system more reliable and resilient.

Node autoscaling fix
As the last piece of the puzzle, there were still few things we could try. One of them was container-native load balancing feature that allows GLB to send traffic directly to the pod which should receive the traffic, skipping the node instance group.
This works on the service and ingress levels and to let Google Kubernetes Engine to know that some particular service should use Network Endpoint Groups (NEGs) and route traffic to pod directly.
To enable this feature service should have this annotation:
cloud.google.com/neg: '{"ingress": true}'
Once this is done, Load Balancer should start sending traffic directly to nginx pods, so in theory, when node scaling events happen, GLB would be aware which pods are healthy and which are not, and avoid sending traffic to the terminating pods.
After 24h there were almost a hundred of scale up/down events, and zero related 502s

Some final tweaks
Experimentally it was proven that following combination provided best results for FirefoxCI:
- Pod’s terminationGracePeriodSeconds: 210
- Pod’s preStop sleep: 120
- GLB’s backend configuration: connectionDraining.drainingTimeoutSec: 60
- Pods are being killed too fast during downscaling
https://github.com/taskcluster/taskcluster/pull/6824
Summary
Major issues and findings were:
- Application was not prepared to be killed gracefully
- Nginx ingress was not waiting long enough for existing connections to be drained
- GLBs configuration didn’t have draining timeout set
- Autoscaling of pods and nodes were not configured optimally
- Network Endpoint Groups were not configured to use container-native load balancing
- Lack of proper E2E monitoring - application thinks the response was successful but client sees 5xx errors instead
- Containers were forced-killed daily for no reason