Running NASM inside C inside GDB. Part 3. Debugging
In previous posts Running NASM inside C inside GDB. Part 1. Integers and Running NASM inside C inside GDB. Part 2. More arguments we executed simple programs.
The problem with simple programs, is that they are simple. You don’t even always need to debug it. But what happens in the real life, is that applications are much bigger and complex. And if your program doesn’t work as expected, you need to understand what went wrong.
Debugger to the rescue!
My experience with debuggers
I first learned to debug programs in mid 90s, when I played around with Borland TurboPascal 5.5 and later 7.0. It has already an IDE with a decent debugger. It allowed me to execute programs step by step, watch variables and understand where the problems came from.
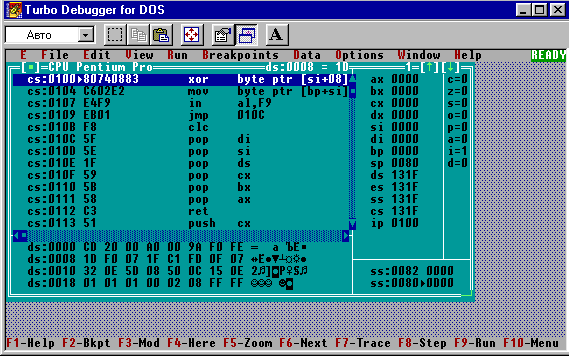
The most awesome was TurboDebugger, which showed memory, stack, registers, CPU flags, program listing. It was really easy to understand how ASM commands change registers and flags.

Unfortunatelly, I haven’t find anything similar for the x86 64bit assembly, but there’s something even more powerful.
GDB / LLDB
In fact, GDB exists for 30 years already! You can still debug everything from the command line.
I will show the examples of working with LLDB
Let’s try to run num_calc inside the debugger: lldb ./num_calc
(lldb) target create "./num_calc"
Current executable set to './num_calc' (x86_64).
Time to execute it for the first time:
(lldb) run
Process 36561 launched: './num_calc' (x86_64)
Not enough arguments.
Usage: ./num_calc [n1] [n2] [n3]
Process 36561 exited with status = 1 (0x00000001)
(lldb) run 1 2 3
Process 36567 launched: './num_calc' (x86_64)
asm_compute(1, 2, 3) = -16
Process 36567 exited with status = 0 (0x00000000)
Ok cool, it runs, but we don’t really do anything.
Breakpoints
Time to pause the execution of the program inside our ASM function. For this we’ll need to add a breakpoint. There are multiple ways of setting it (check manual), but we’ll add a breakpoint by function name asm_compute:
(lldb) breakpoint set -n asm_compute
Breakpoint 2: where = num_calc`asm_compute, address = 0x0000000100000f08
What will happen next, if we’d run the programm again, it would stop right in the beginning of the function:
(lldb) run 7 8 9
Process 36778 launched: './num_calc' (x86_64)
Process 36778 stopped
* thread #1: tid = 0x21ceca, 0x0000000100000f08 num_calc`asm_compute, queue = 'com.apple.main-thread', stop reason = breakpoint 2.1
    frame #0: 0x0000000100000f08 num_calc`asm_compute
num_calc`asm_compute:
->  0x100000f08 <+0>:  subq   $0x5, %rdx
    0x100000f0c <+4>:  shlq   $0x3, %rdi
    0x100000f10 <+8>:  shrq   $0x2, %rsi
    0x100000f14 <+12>: addq   %rsi, %rdi
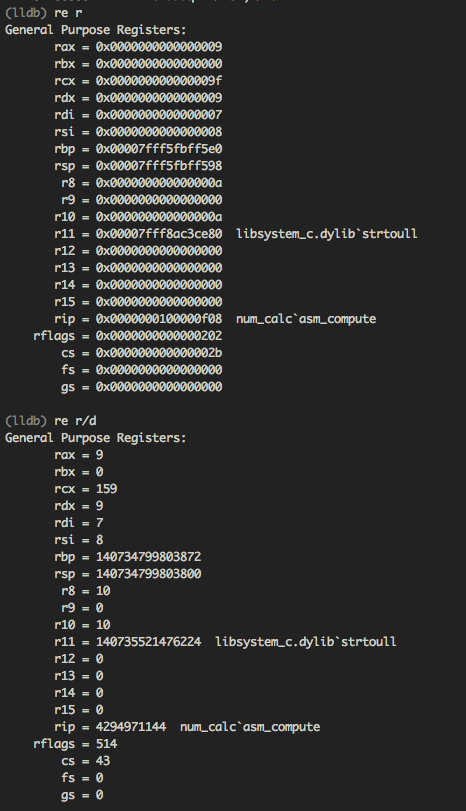
We can check the state of the registers with the help of re r or re r/d (for decimal), or just some of the registers re r rax rbx rdx

What can we learn from this screen? It shows that our arguments are now in rdi, rsi, rdx registers (7, 8, 9).
We can also learn that other registers are pretty random (better not to touch rbp, rsp, rip registers, as they are pretty important).
Ok, let’s get back to the code: disassemble or di will show us where we paused. Time to proceed with the next or n command:
(lldb) di
num_calc`asm_compute:
->  0x100000f08 <+0>:  subq   $0x5, %rdx
(lldb) re r/d rdx
     rdx = 9
(lldb) n
num_calc`asm_compute:
->  0x100000f0c <+4>:  shlq   $0x3, %rdi
(lldb) re r/d rdx
     rdx = 4
And we could see that first command rdx-5 executed successfully, the value of the register changed.
Next command will multiply rdi by 8 by shifting 3 bits left:
(lldb) re r -f b rdi
     rdi = 0b0000000000000000000000000000000000000000000000000000000000000111
(lldb) re r -f d rdi
     rdi = 7
(lldb) n
num_calc`asm_compute:
->  0x100000f10 <+8>:  shrq   $0x2, %rsi
(lldb) re r -f d rdi
     rdi = 56
(lldb) re r -f b rdi
     rdi = 0b0000000000000000000000000000000000000000000000000000000000111000
Quite easy to see that by three 111 bits shifted by 3 positions left, and we have 7*8=56 in rdi.
Next command will divide rsi by 4 or is the same as shifting bits right by 2 positions:
(lldb) re r -f d rsi
     rsi = 8
(lldb) re r -f b rsi
     rsi = 0b0000000000000000000000000000000000000000000000000000000000001000
(lldb) n
num_calc`asm_compute:
->  0x100000f14 <+12>: addq   %rsi, %rdi
(lldb) re r -f b rsi
     rsi = 0b0000000000000000000000000000000000000000000000000000000000000010
(lldb) re r -f d rsi
     rsi = 2
Again, bits shifted two positions right, and the answer is 8/4=2 easy ;)
Next we would add rsi to the rdi
(lldb) re r -f d rsi rdi
     rsi = 2
     rdi = 56
(lldb) n
num_calc`asm_compute:
->  0x100000f17 <+15>: movq   %rdx, %rax
(lldb) re r -f d rsi rdi
     rsi = 2
     rdi = 58
Here we have 56+2=58. Time to multiply the numbers:
(lldb) re r -f d rdx rax rdi
     rdx = 4
     rax = 4
     rdi = 58
(lldb) n
num_calc`asm_compute:
->  0x100000f1d <+21>: retq
(lldb) re r -f d rdx rax rdi
     rdx = 0
     rax = 232
     rdi = 58
Final piece of calculation done: rax = rax * rdi or rax = 58 * 4 = 232
Conclusion
That’s it. Setting breakpoints in the code, stepping over the lines of code and examining the state of the registers can help understanding where calculation goes wrong.
Source code on github: nasm-c-gdb